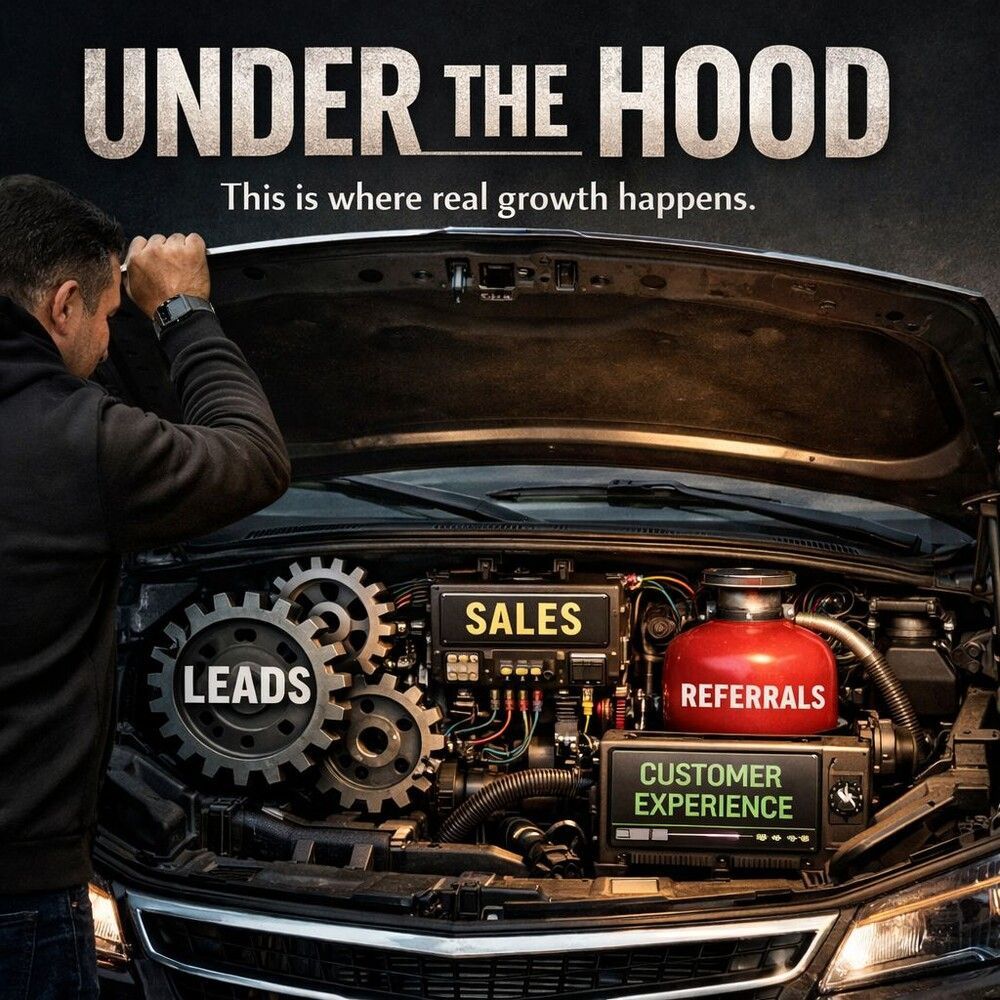
Inside the Engine: How Car Dealerships Really Work. A Full Diagnostic Breakdown of the Systems, Economics, and Hidden Profit Centers

Most people think car dealerships make money by selling cars.
That’s surface-level thinking.
If we were to examine a dealership like a doctor examines a patient—running bloodwork, X-rays, and full system diagnostics—we’d quickly realize:
👉 The vehicle sale is just one small part of a much larger financial machine.
Let’s break it down.
🧠 The Brain: Ownership, Structure & Manufacturer Control
Most dealerships operate under franchise agreements with manufacturers like Ford Motor Company, General Motors, and Toyota Motor Corporation.
What most people don’t see:
- Dealers don’t fully control pricing on new vehicles
- Inventory is often allocated, not freely chosen
- Manufacturers provide: Volume bonuses Marketing support Floorplan assistance
Dealer Groups vs Single Rooftops
Large groups (AutoNation, Lithia, etc.) operate like mini private equity firms:
- Shared back-office systems
- Centralized marketing
- Scaled purchasing power
👉 The real advantage is systemization across multiple revenue streams, not just selling more cars.
❤️ The Sales Engine: New vs Used Vehicles
🚘 New Car Sales (Low Margin, High Strategy)
- Average front-end margins: 3–8%
- Profit depends heavily on: Manufacturer incentives Quarterly/annual volume bonuses Financing participation
👉 Many deals are structured to
break even upfront just to unlock backend profits.
🔄 Used Car Sales (Where Real Money Lives)
- Margins: 10–25%+
- Full control over: Pricing Acquisition Reconditioning
Key Profit Drivers:
- Trade-ins (bought below market value)
- Auction arbitrage
- Speed of inventory turn
👉 The best operators focus on turn rate, not price maximization.

This is where dealerships quietly generate massive profit per deal.
Revenue Streams:
- Loan interest markups (dealer reserve)
- Extended warranties
- GAP insurance
- Tire/wheel protection
- Maintenance packages
Numbers That Matter:
- $1,500–$3,000+ profit per vehicle (sometimes more)
👉 A weak F&I department can destroy profitability. 👉 A strong one can carry the entire dealership.
🦴 The Backbone: Fixed Operations (Service & Parts)

This is the most stable and predictable revenue stream.
Why it matters:
- Recurring customers
- High margins
- Less dependent on market swings
Profit Structure:
- Labor margins: 60–75%
- Parts margins: 30–50%
Long-Term Play:
- Sell a car once
- Service it for 5–10+ years
👉 Service departments are what keep dealerships alive during downturns.
👤 Perspective From Inside the Industry
My experience in the automotive industry goes back to 2009, starting on the front lines in sales with Mercedes-Benz and Smart vehicles.
That foundation gave me more than just sales experience—it gave me a real understanding of customer psychology, deal structure, and the pressure of performance inside a dealership.
From there, I moved beyond the showroom floor and into the infrastructure side of the business.
I partnered with one of the largest dealership groups to help launch and scale an insurance agency program with Allstate—building one of the fastest-growing agencies within that model.
That experience gave me access to something most never see:
👉 A seat at the table behind the scenes.
I was able to sit in high-level meetings and study the backbone of dealership operations across:
- Profit centers
- Risk management
- Employee benefits
- Financial structuring
But more importantly…
I wasn’t just observing—I was actively contributing within what I call the “spokes of the wheel.”
Supporting:
Additional profit centers
Insurance integrations
Employee benefit programs that strengthen retention and performance
Infrastructure that aligns with long-term dealership growth
That dual perspective—front-end sales + backend systems—is what allows me to see dealerships differently.
👉 Not just as places that sell cars… But as complex financial ecosystems with untapped opportunities beneath the surface.

💰 The Cash Flow System: Floorplan Financing
One of the least understood—but most critical—systems.
What is Floorplan?
Dealerships don’t usually own their inventory outright.
They finance it through lenders like:
- Ally Financial
- JPMorgan Chase
How it works:
- Each vehicle is financed while sitting on the lot
- Interest accrues daily
Pressure Point:
- The longer a car sits → the more it costs
👉 This is why dealerships push aging inventory aggressively.
📊 The Diagnostics: Metrics That Determine Survival
Think of these as the dealership’s “blood test results.”
Inventory Health
- Days Supply (how long cars sit)
- Turn Rate (how fast inventory sells)
Profitability
- Front-End Gross (vehicle sale)
- Back-End Gross (F&I)
Marketing Efficiency
- Cost per lead
- Cost per sale
Service Metrics
- Customer retention
- Repair order value
- Technician productivity
👉 If these numbers are off, the dealership is bleeding money—whether they realize it or not.
🧲 The Lead Engine: Marketing & Customer Acquisition
Modern dealerships are marketing companies disguised as car sellers.
Channels:
- Google search + paid ads
- Social media targeting
- CRM follow-up systems
- Third-party platforms (AutoTrader, Cars.com)
Reality:
- Most dealerships overspend on leads
- Poor follow-up = lost revenue
👉 The dealership that wins is the one that:
- Responds fastest
- Nurtures longest
- Tracks everything
👥 The Human Factor: Sales Teams & Culture
Compensation Structure:
- Commission-based
- Bonus tiers
- Volume incentives
Common Problems:
- High turnover
- Inconsistent training
- Poor customer experience
👉 The best dealerships operate like sales organizations with systems, not just individual performers.
⚠️ The Hidden Leaks (Where Millions Are Lost)
Even top-performing dealerships often have:
- Overpriced insurance programs
- Inefficient benefit structures
- Poor vendor contracts
- Redundant expenses across departments
- Underperforming service retention
👉 These are not visible on the surface—but they compound over time.
🔬 The Real Truth About Dealership Success
The dealerships that dominate are not the ones with:
- The nicest buildings
- The most inventory
- The flashiest marketing
They are the ones that:
✔ Understand every number
✔ Optimize every department
✔ Integrate systems across the entire operation
✔ Treat the business like a financial machine—not a sales lot
🧩 Final Thought: Looking Under the Hood
A dealership is not a car business.
👉 It is a multi-layered financial ecosystem made up of:
- Sales
- Financing
- Service
- Insurance
- Marketing
- Operations
Each part either:
- Produces profit
- Or silently drains it
The real opportunity isn’t in selling more cars… it’s in understanding the systems that drive the entire operation.
👉 If you’re a dealer, operator, or executive looking to uncover hidden profit, reduce inefficiencies, and strengthen your infrastructure—let’s connect.