“Inflation Exposed: The Truth About Rising Prices from 2000 to 2025 — And What’s Coming Next”
We’ve reached a defining moment in history — one where numbers don’t lie, and the truth can no longer be ignored. From 2000 to 2025, prices on nearly everything we depend on — housing, food, insurance, energy, healthcare — have nearly doubled. The world changed faster than most people realized, and now, as we head into 2026 and beyond, the question isn’t “What happened?” anymore — it’s “What are you going to do about it?”
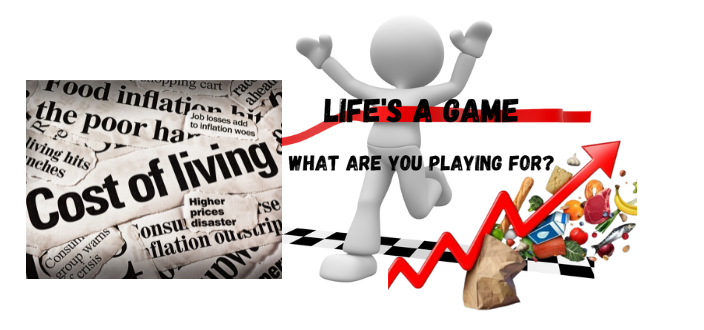
For years, many trusted the system to work itself out. But the truth is, inflation, debt, and financial uncertainty have become a way of life — not a temporary phase. The cost of living is rising, the middle class is shrinking, and those who keep waiting for “things to calm down” are quietly losing ground every single day.
This isn’t about panic. It’s about preparation. It’s about clarity. And it’s about taking responsibility for your future — before someone else decides it for you.
Whether you’re a business owner, investor, or individual just trying to make sense of it all, understanding where we’ve come from and where we’re going financially is the foundation of true freedom. The next five years will separate the reactive from the prepared — those who follow the noise from those who study the facts and act with intention.
Now is the time to focus on the truth, take control of your financial path, and prepare strategically for the future that’s already unfolding.
1. How much have prices really changed since 2000?
Using the official CPI (all urban consumers, “all items”):
- Total price increase 2000 → 2025: about +88%
- Average annual inflation: about 2.56% per year In 2013 Dollars
Plain English:
$100 of “everyday stuff” in 2000 costs about $188 in 2025.
The underlying CPI index went from 172.2 in 2000 to about 324 in 2025. In 2013 Dollars+1
Recent pace:
- 2021: ~4.7%
- 2022: ~8.0% (big spike)
- 2023: ~4.1%
- 2024: ~2.9%
- 2025 (12 months ending Sept): about 3.0% In 2013 Dollars+1
So the crazy part is really
2021–2023; before that, inflation mostly hung in the 2–3% range.
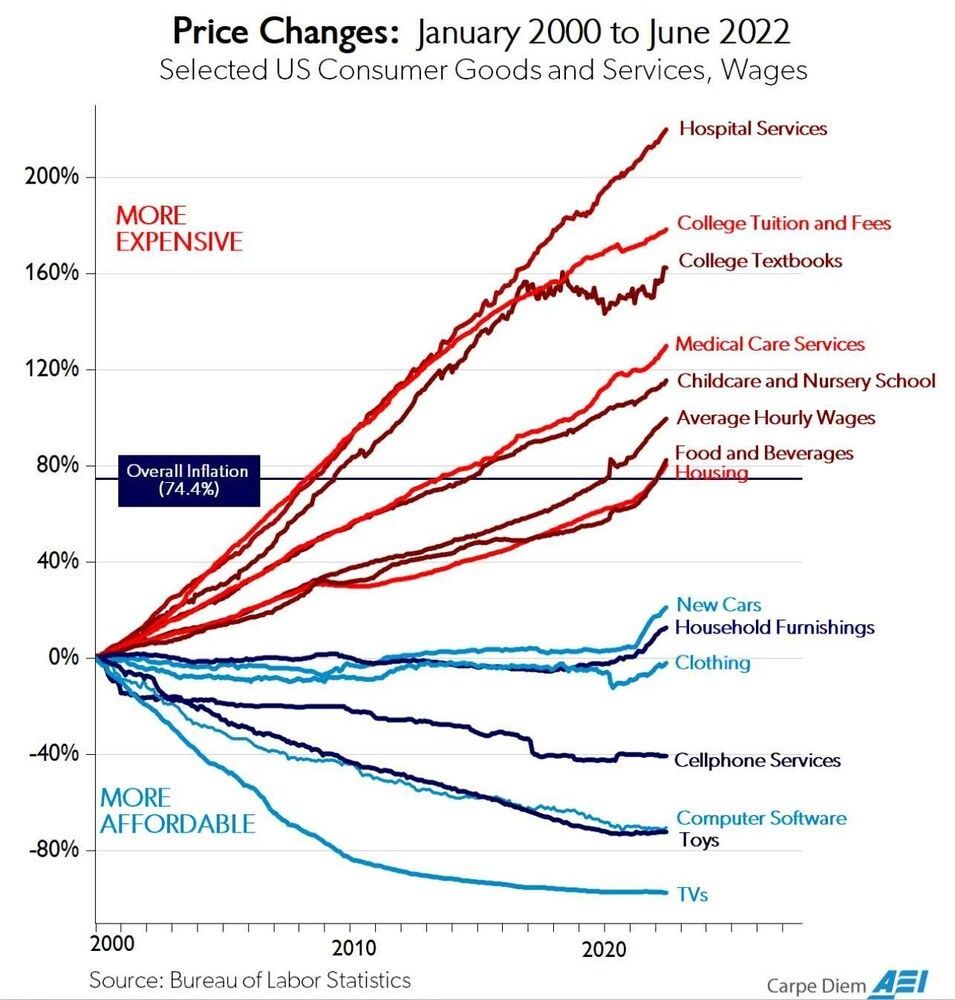
2. Which categories went up the most (and the least)?
Between 2000 and 2025, some categories ran way hotter than the overall 88% CPI. Using CPI category data: In 2013 Dollars
Above-average inflation:
- 🏠 Housing
- 🩺 Medical care
- 🍽️ Food & beverages
- 💅 Other goods & services (personal care, etc.)
Near or below overall CPI:
- 🚗 Transportation
- 🎮 Recreation
- 🎓📱 Education & communication (as a combined CPI bucket)
- 👔 Apparel
Selected item examples 2000 → 2025: In 2013 Dollars
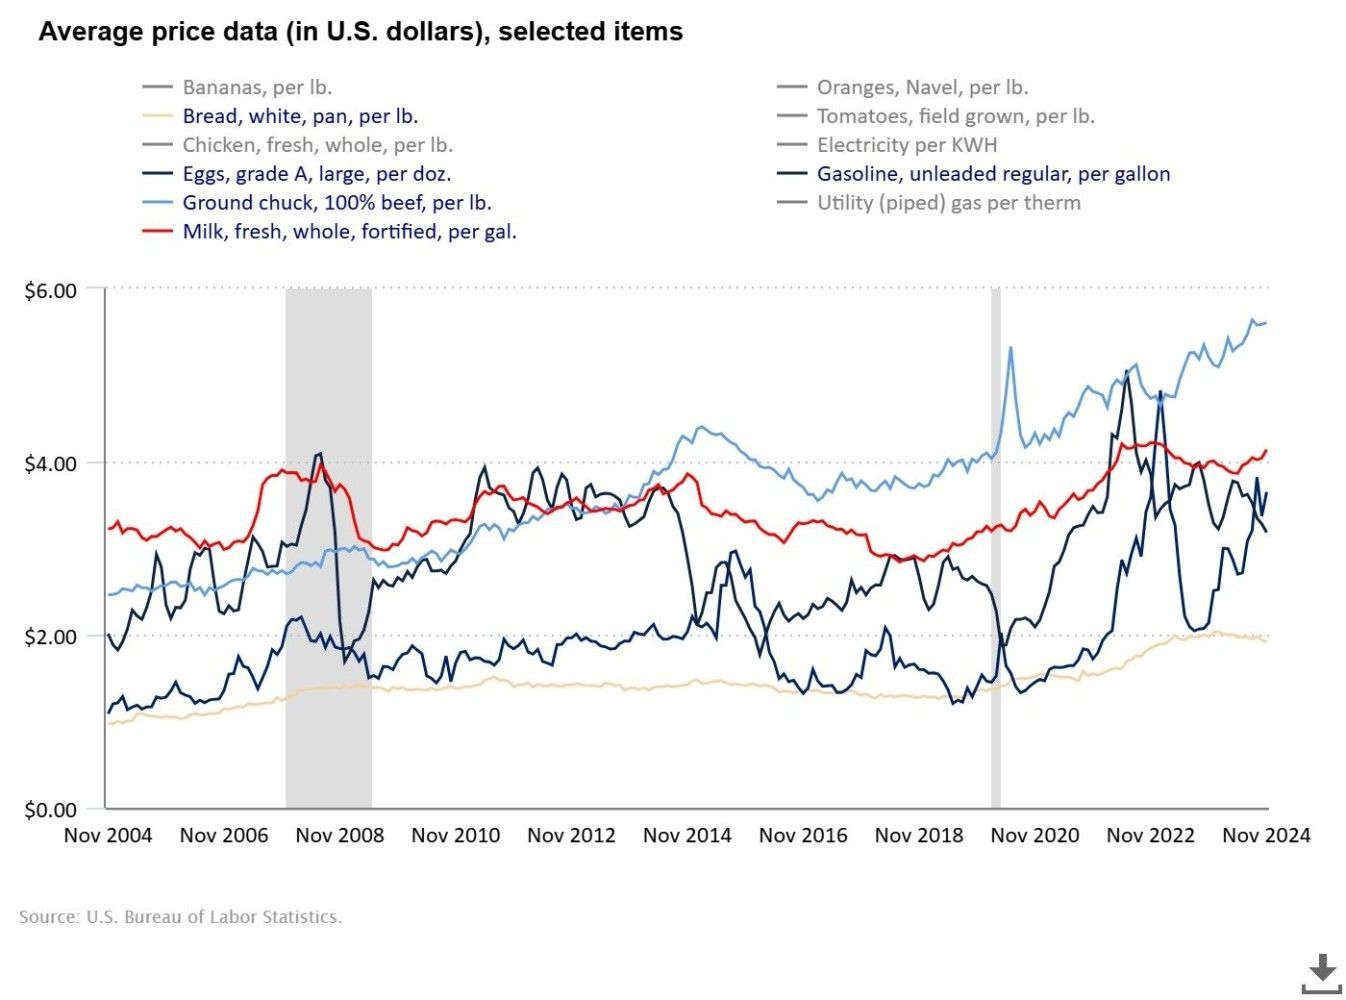
- Gasoline: $1.30 → $3.29 per gallon
- Bread: $0.91 → $1.84 per loaf
- Eggs: $0.98 → $3.59 per dozen
- Whole chicken: $1.06 → $2.08 per lb
- Electricity: $0.08 → $0.19 per kWh
So the story is:
Shelter, healthcare, utilities, and food have eaten people alive. Clothing and many tech/consumer goods have stayed cheap or even deflated in real terms.
3. Timeline: what actually happened 2000–2025?
Quick decade-ish breakdown:
2000–2007: “Normal-ish” pre-crisis inflation
- CPI mostly in the 2–3.5% range.
- Globalization + China manufacturing + tech = cheap goods.
- Housing starts and credit expansion pushing up home prices in many regions.
2008–2013: Financial crisis, commodities spike, then hangover
- 2008: Energy & food prices spike → higher headline inflation.
- 2009: Brief deflation (~–0.4%) as the global financial crisis hits. In 2013 Dollars+1
- 2010–2013: Weak demand, high unemployment → low, stable inflation.
2014–2019: Low-rate, low-volatility era
- Fed rates relatively low; QE in the background.
- Inflation mostly around 2%, sometimes less.
- Asset prices (stocks, real estate) rise much faster than wages, but consumer goods inflation is tame.
2020–2025: Pandemic, supply chains, stimulus, and shock
- 2020: COVID shock. Brief deflationary fear, then massive fiscal + monetary stimulus.
- 2021–2022:
- 2023–2025:
4. Key structural factors behind these price changes
High level:
- Globalization vs. deglobalization
- Technology & digitization
- Housing & land constraints
- Healthcare system incentives
- Energy & commodities
- Monetary & fiscal policy
5. 2026–2030: What do the projections say?
Nobody can see the future, but we do have official projections.
5.1 Baseline forecast (CBO & IMF)
The U.S. Congressional Budget Office (CBO) projects that: CRFB+1
- PCE inflation (Fed’s preferred measure)
IMF’s October 2025 World Economic Outlook: IMF+1
- Global inflation expected to keep falling,
- But U.S. inflation stays a bit above 2%, with risks tilted to the upside (tariffs, geopolitics, supply disruptions).
So the central-banker dream is:
U.S. settles into something like 2–2.5% inflation per year through 2030, not 6–8%.
5.2 What does that mean numerically for 2026–2030?
If we assume:
- Roughly 2% per year from 2026–2030 (a “soft landing” scenario),
Then over 5 years, prices increase by about:
- 1.025≈1.101.02^5 ≈ 1.101.025≈1.10
- So another ~10% on top of 2025 levels.
Combine that with the +88% since 2000:
- 2000 → 2025: +88% (factor ~1.88)
- 2025 → 2030: +10% (factor ~1.10)
Overall:
By 2030, the same basket that was $100 in 2000 could be roughly $208–$215, depending on whether inflation averages closer to 2% or drifts more like 2.5–3%.
If inflation averages, say, 3% instead:
- 2026–2030: 1.035≈1.161.03^5 ≈ 1.161.035≈1.16 → ~16% extra
- That would put 2000–2030 prices around +120% (just over double plus a bit).
5.3 Where are the pressure points for 2026–2030?
- Based on current trends & forecasts:
- Shelter
- Healthcare & elder care
- Energy & green transition
- Labor & AI
- Trade & tariffs
So:
headline inflation might calm down, but specific categories (healthcare, housing, insurance, some services) could still feel brutal.
6. Strategic takeaways (for planning 2026–2030)
Thinking like an operator/investor (which fits your world):
- Anything with pricing power in “inflation-heavy” categories is valuable.
- Debt structure matters more than ever.
- Real assets vs. cash.
- Wages will keep chasing prices.
- AI & automation as margin protection, not magic.
From Awareness to Understanding
The truth is, numbers don’t lie — and when you take a step back to see how prices, policies, and purchasing power have shifted over the last 25 years, you begin to see the full picture. This isn’t just about inflation; it’s about understanding the real cost of waiting, the impact of decisions made over decades, and the opportunities hidden inside the chaos.
To prepare for the future, we must first understand the past — how we got here, what changed, and what’s still coming. The data tells a story of transformation, resilience, and warning signs that too many people ignore. So, before you plan your next move, let’s look closely at the facts.
Continue the conversation and let's get opinions on this from a variety of specialist and other educated leaders.