
Tracking Your Numbers and Goals: Turning Intentions into Daily Execution

Staying focused on your goals isn’t just about motivation—it’s about measurement, feedback, and creating systems that make the right actions automatic. Many people can articulate what they want (more income, better health, consistent growth), but what they’re saying and understanding doesn’t always register in their daily habits. This article bridges that gap with a practical framework for tracking numbers, aligning habits, and building systems that actually deliver results.
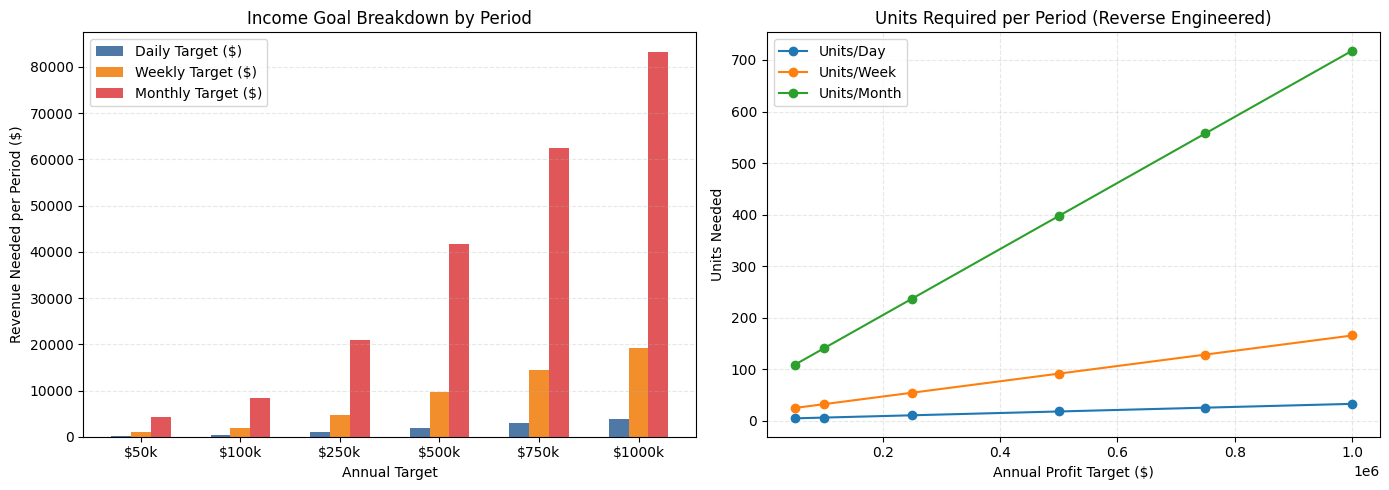
Income goal tracker: breakdown and reverse-engineered sales plan
I created two charts:
- Income goal breakdown by period (daily, weekly, monthly)
- Units required per period given assumptions (reverse engineered)
Summary of the tables used in the charts:

Breakdown (Revenue per Period):
- Annual Target ($) | Monthly | Weekly | Daily
- 50,000 | 4,166.67 | 961.54 | 192.31
- 100,000 | 8,333.33 | 1,923.08 | 384.62
- 250,000 | 20,833.33 | 4,807.69 | 961.54
- 500,000 | 41,666.67 | 9,615.38 | 1,923.08
- 750,000 | 62,500.00 | 14,423.08 | 2,884.62
- 1,000,000 | 83,333.33 | 19,230.77 | 3,846.15
Reverse Engineered Sales Plan (given assumptions below):
- Annual Target | Required Revenue | Units/Year | Units/Month | Units/Week | Units/Day
- 50,000 |261,538 | 1,307.7 | 109.0 | 25.1 | 5.03
- 100,000 | 338,462 | 1,692.3 | 141.0 | 32.5 | 6.51
- 250,000 | 569,231 | 2,846.2 | 237.2 | 54.7 | 10.95
- 500,000 | 953,846 | 4,769.2 | 397.4 | 91.7 | 18.34
- 750,000 | 1,338,462 | 6,692.3 | 557.7 | 128.7 | 25.74
- 1,000,000 | 1,723,077 | 8,615.4 | 717.9 | 165.7 | 33.14
Assumptions used:
- Avg order value: $200
- COGS: 35% of revenue
- Operating expenses (annual): $120,000
- Working days/year: 260; weeks/year: 52; months/year: 12
How to use this:
- Adjust average order value, COGS%, and annual operating expenses to match your business.
- The “Units per Day/Week/Month” tells you how many sales you need to hit your profit target after covering costs.
Why Goals Fail: The Intention-Execution Gap
Most goals fail for three reasons:
- Vague outcomes: “Make more money,” “get fit,” “grow my business” aren’t measurable or schedulable.
- No leading indicators: People track end results (revenue, weight) but not the actions that produce them (calls, workouts, demos).
- Weak systems: If hitting a target relies on willpower, you’ll lose when energy dips. Systems keep you on track when motivation fades.
The fix: Clarify outcomes, define leading indicators, and operationalize them into a simple daily system you can track.
The 4-Part System for Hitting Your Goals
Define the Outcome Numerically
- Make goals specific, time-bound, and measurable.
- Examples: Revenue: “$300,000 annual profit by December 31” Fitness: “15% body fat by June 30” Content: “2 high-quality posts per week for 6 months”
Reverse Engineer the Numbers Break the annual goal into quarterly, monthly, weekly, and daily targets.
For business income, think in this chain:
- Annual profit target → Required revenue (accounting for expenses and margins)
- Required revenue → Number of units/orders (based on average order value)
- Units → Leading indicators (traffic, leads, calls, demos, proposals)
- Leading indicators → Daily actions scheduled on calendar
Example:
- Annual profit target: $200,000
- Operating expenses: $120,000
- Gross margin: 60% (COGS = 40%)
- Revenue needed: (Profit + OpEx) / Margin = ($200k + $120k) / 0.60 = $533,333
- Avg order value: $500 → Units/year ≈ 1,067 → Units/month ≈ 89 → Units/week ≈ 21
- If close rate = 20%, you need ≈ 5 sales conversations/week → If 25% of booked calls convert to sales conversations, book ≈ 20 calls/week → If 10% of outreach leads to booked calls, you need ≈ 200 quality outreaches/week → ≈ 40/day (5 workdays)
Now you have a daily action: 40 targeted outreaches/day tied to your annual profit goal.
Convert Leading Indicators to Habits and Systems
- Habit = the action you do (e.g., “40 targeted outreaches/day”)
- System = the workflow, tools, and schedule that make the habit happen consistently
System design checklist:
- Time-boxing: Reserve non-negotiable blocks on your calendar (e.g., “Prospecting Power Hour 8–10am”).
- Templates and assets: Outreach scripts, proposal templates, pricing calculators, objection FAQs.
- CRM/Tracker: Simple pipeline stages (Lead → Qualified → Meeting → Proposal → Won/Lost).
- Automation: Use a CRM or spreadsheet to track counts and conversion rates. Pre-schedule follow-ups.
- Environment: Reduce friction (e.g., prebuilt call lists; notifications off during deep work).
Track, Review, Adjust (The Weekly Operating Rhythm)
- Daily: Record your leading indicators. Did you hit your count? Why/why not?
- Weekly review (30–45 mins): Score your leading indicators vs target (e.g., outreach, calls, demos). Inspect conversion rates at each stage. Where is the bottleneck? Decide 1 improvement for next week (better targeting, new script, faster follow-up).
- Monthly: Reconcile financials. Compare revenue, margin, expenses vs plan. Adjust targets or tactics.
Remember: numbers are feedback, not judgment. You’re a scientist tuning a system.

Aligning Beliefs, Behavior, and Results
Many people “know” what to do but don’t do it consistently. Here’s how to fix the disconnect:
- Make it visible: What’s tracked improves. Use a visible dashboard (whiteboard, wall chart, or spreadsheet) to show daily counts and weekly progress.
- Shrink the action: If 40 outreaches feels heavy, commit to the “first 5.” Momentum beats resistance.
- Create accountability: Public weekly check-ins with a partner or team. Behavior follows social commitments.
- Pre-commitment: Book meetings with yourself. Protect these blocks like client calls.
- Standardize the “first 10 minutes”: Always start your work block the same way (open CRM, load today’s list, call the first 5).
- Reward loops: Attach small, immediate rewards to habit completion to retrain your brain.
- Scripts > willpower: Create decision-light environments with scripts, templates, and clear next steps.
A Simple, Repeatable Dashboard
Track a handful of numbers. Don’t drown in data—focus on a few that drive outcomes.
- Outcome metrics (lagging): Revenue, Profit, MRR (if subscription) Customer count, Churn Average order value, Gross margin
- Leading indicators: Pipeline: New leads, qualified leads, demos, proposals, close rate Activity: Outreaches sent, calls made, follow-ups, content posts Speed: Time-to-first-response, follow-up cadence adherence
- Health metrics (system effectiveness): On-time completion of daily blocks (%) Time spent in deep work vs reactive work Response time to hot leads SLA adherence (follow-up within 24 hours, etc.)
Pro tip:
Color code weekly performance (green = met/exceeded, yellow = within 10%, red = misses). This makes patterns obvious.
Example: Service Business Weekly Scorecard
- Targets: 200 outreaches/week 20 booked calls/week 5 sales conversations/week 1 new client/week
- Actual: 160 outreaches (80% → red) 18 booked calls (90% → yellow) 6 sales conversations (120% → green) 0 new clients (0% → red)
- Diagnosis: Outreach volume low; conversation rate high; close rate weak.
- Action: Improve discovery and proposal clarity. Add “value recap + ROI” slide. Schedule proposal reviews within 48 hours.
Common Pitfalls and Fixes
- Pitfall: Chasing more tools instead of more reps. Fix: Pick one CRM/spreadsheet. Master it. Consistency > sophistication.
- Pitfall: Tracking too many metrics. Fix: Track 3–5 leading indicators and 2–3 outcomes. Review weekly.
- Pitfall: Irregular follow-up. Fix: Automate sequences. Calendar tasks for day-2, day-4, day-7 follow-ups.
- Pitfall: No debriefs after losses. Fix: Post-mortem each lost deal: cause, countermeasure, script update.
- Pitfall: Goals not visible daily. Fix: Put the weekly targets on your wall or at the top of your CRM.
The Mindset that Sustains Focus
- Process over outcome: You control inputs; outcomes follow.
- Small wins compound: Hitting 90% of your daily actions beats sporadic 150%.
- Curiosity over shame: Misses are data. Ask “What’s the bottleneck?” not “What’s wrong with me?”
- Identity shift: “I am the type of person who does my numbers daily.”
A 15-Minute Daily Routine
- 2 minutes: Review today’s targets and yesterday’s score.
- 10 minutes: Prime your pipeline (load list, prep scripts, open CRM).
- 3 minutes: Schedule follow-ups and note quick improvements.
Quick Start: Your One-Page Plan
- Goal: Annual profit target $X by [date]
- Economics: Avg order value $A Gross margin M% Operating expenses $E/year
- Reverse-engineered targets: Revenue needed = (X + E) / M Units/year = Revenue / A Units/week; Units/day
- Leading indicators: Outreaches, calls, demos, proposals; expected conversion rates
- Systems: Time blocks, templates, CRM pipeline, follow-up cadence
- Weekly review: Metrics vs targets, bottleneck, one improvement
If you would like more information and or resources please feel free to send a message or learn more of our in depth services CLICK HERE


Get Your FREE 7 Day Trial and Support to the most affordable All In One Marketing Platform
Special Bonus: CLICK HERE
Get FREE Coaching 2 Hours per month when become a member.